The data & the sonification
behind Guadiana in Four Movements
Guadiana in Four Movements is a series of audiovisual experiments that combine distinct data sets in the form of data sonification, archive and found footage, and soundscapes.
In this walkthrough, I'll explain our steps to create the data sonification part, the reason and the data behind it.
We opted for an auditory method like data sonification instead of data visualisation because of the immense amount of data we gathered from the region. Whether these data stem from IPCC, Eurostat, or national and regional data portals from Spain and Portugal and their respective research centres and universities, it felt almost impossible to deploy the available data in a meaningful way to outline the dimensions of the issues that we were depicting. Hereupon, the constraints of the program Limits to Growth Inspiration Forum Lab regarding the duration, resources and space made us clear that we had to show all that intricate layers of information in a reduced way, resulting in the sonification of the data. Data-driven projects, especially visual ones, notoriously fail to demonstrate the human aspect of the issues they are tackling; avoiding this particular hindrance has been one of our initial goals. What better way to show the dimensions and dissimilarities of climate crisis scenarios with human and emotional components than by combining music, noise and soundscapes?
The Research
Even if this is a very experimental and conceptual project transcending fields of film, sound and thorough anthropological research, the data-drivenness based on historical references and future computational modellings of the Guadiana River estuary set up the point of origin for our research process.
As we rummaged through data and research on mean temperatures rise, water scarcity, salinity, invasive species, hazard risks, and socio-economical factors affected by the repercussions of the climate crisis in the region, we decided to use some of the essential data for the data sonification and highlighting or mentioning other issues within the realms of qualitative imagery and soundscapes.
The Data
Understanding the available data is crucial before selecting certain data sets. What is it measuring? How was it collected? What do these discrepancies in the data points mean?
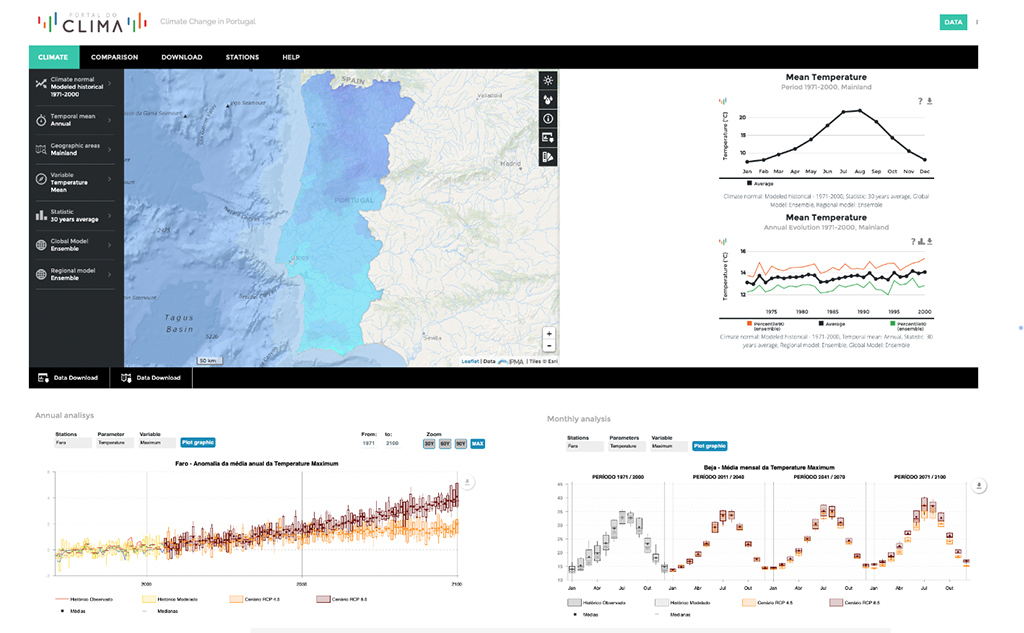
Utilising intervallic dynamics —akin to other inspirational data sonification works on the climate crisis — laid the groundwork for the sonification of this project. However, the data on the projected mean temperatures from the IPCC's sixth assessment report, national data portals "Portal do Clima" (Portugal) and "Confederacion Hidrografica del Guadiana" (Spain) failed to treat the Guadiana ecosystem as a whole entity, placing it onto different jurisdictions; in short, distinct and incohesive data sources.
To overcome this obstacle, we focused on the transboundary part of the river, the lower and partially middle Guadiana River estuary. We used the broader term estuary rather than river basin to mesh up the available data of the adjacent jurisdictions of both riparian countries, Evora, Bejo and Faro on the Portuguese side; Huelva on the Spanish side.
Except for the mean temperatures, the datasets of minimum & maximum temperatures and the days over 35°C are also selected as the basis for auditory dimensions.
The Sonification
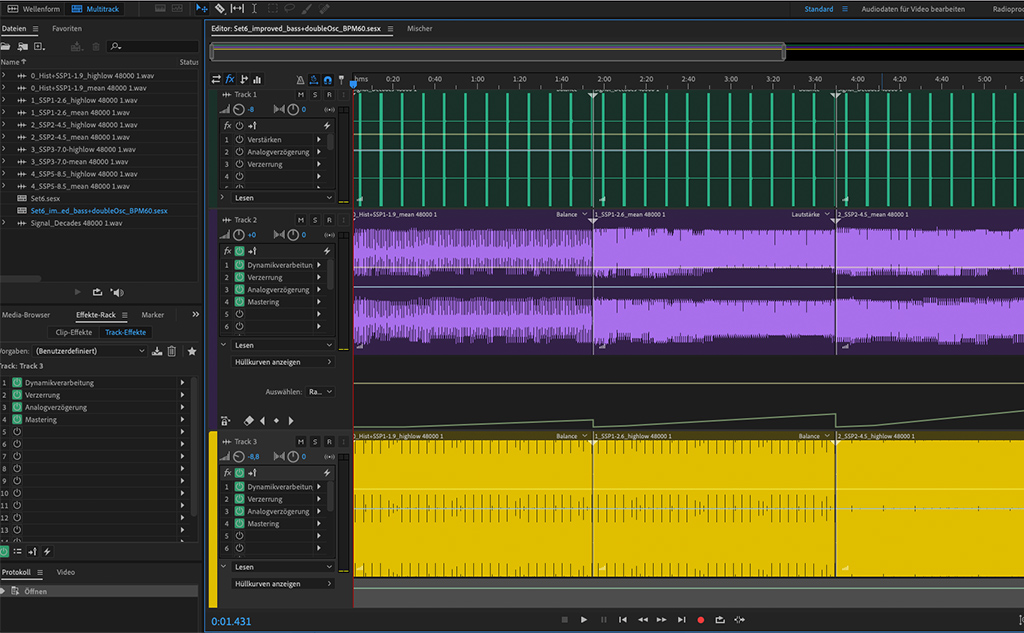
There is a variety of great tools and libraries for data sonification. Since this is my first attempt, I decided upon TwoTone for its intuitive interface to make your compositions from data sets without any prior musical or programming knowledge and fantastic midi support. Thanks to everyone who brought this non-commercial browser-based software to life.
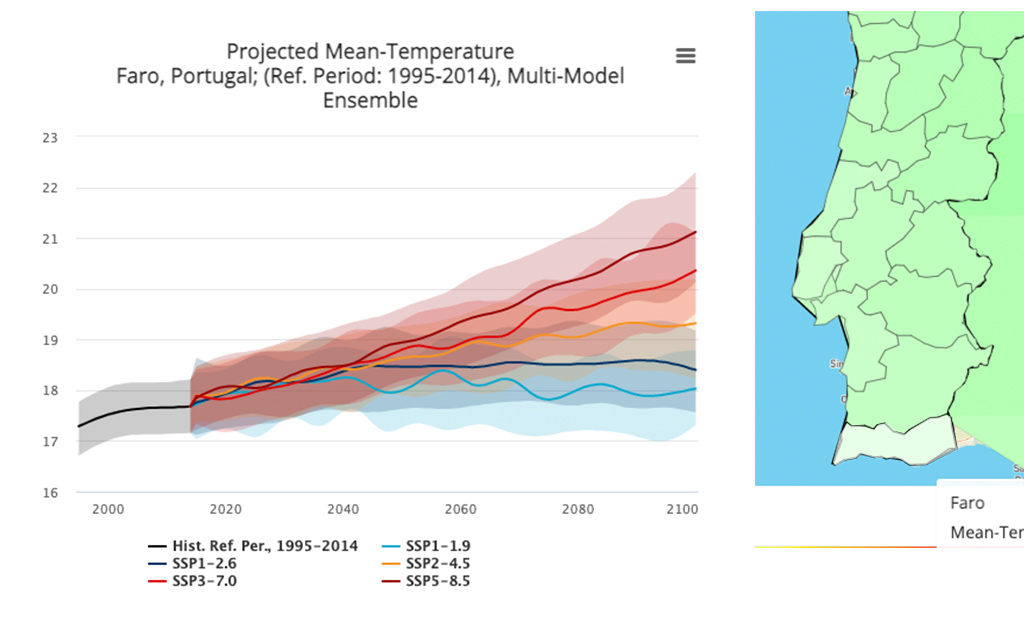
The mean temperatures of four different IPCC scenarios (≈1.8°C, ≈2.7°C, ≈3.6°C, and ≈4.4°C) as double bass acts as the core auditory dimension, building momentum towards the end. The consecutive two other data sets of maximum and minimum temperatures as synth cause a metronome effect and create a quasi-melody. I used the midi output function of TwoTone to create a more advanced sound on Bitwig Studio. Last, the data set of days over 35°C was used as upwards spiralling distortion levels made by Adobe Audition.
The timeframe of the data sonification spans from historical reference data (1986 to 2014) to the future climate scenarios until 2100. Each second corresponds to a year. Every decade we hear a signal.
Surely, there are some arbitrary creative and musical decisions in the process. For example, as someone with almost no prior knowledge of music, I used the affective key characteristics from Christian Schubart's "Ideen zu einer Aesthetik der Tonkunst" (1806) as a benchmark for setting a distinctive tone for each scenario in which he described the musical keys based on literary depictions of landscapes, humans and their moods. I then repeated the previous steps numerous times until we were satisfied with the composition.
I'd like to thank Brian Foo for creating inspirational data sonification works relished with superb data cookbooks. Also, the producers of the amazing data sonification podcast Loud Numbers' Miriam Quick and Duncan Geere and the Data Sonification Archive's curators Sara Lenzi and Paolo Ciuccarelli. Thanks to their efforts, I could easily navigate through uncharted waters.
And also a special thanks to all the remarkable scientists and their respective institutions for their contributions to computational modellings on the Guadiana River estuary. Though we didn't use their data or research directly in our audiovisual piece, we certainly got more knowledgeable on the issues and intricate dynamics of Guadiana.
About us
Burak Korkmaz
(1984) is Münster and Seville-based independent information designer. He takes over data-driven visualisations for politics, academia and civil society.
burakkorkmaz.de
Pedro Figueiredo Neto
(1984) is a Lisbon-based anthropologist and filmmaker. Currently, he is a research fellow at the Social Science Institute, University of Lisbon (ICS-ULisboa).
pedrofneto.com